Two Forms of a Table
Three frontier models can't agree on the average of one column in a clean table. Why the form you read and the form you compute on differ, and why both matter.

A table in a document is already an answer to a question — just not yours.
When someone laid it out, they were answering “how do I show this clearly?” They chose which numbers to put side by side, what to nest under what, which cells to leave blank because the value was obvious from context. The arrangement is a communication decision, optimized for a human reading. It is genuinely good at that. It is not, for that same reason, good at much else.
The trouble starts when you ask the table a question it wasn’t arranged to answer. What’s the average of this column? Which row has the highest margin? How did this figure change year over year? The layout that made the table easy to read does nothing for these — and sometimes actively fights them.
Take Table 3 from the original Transformer paper, Attention Is All You Need. It lists twenty variations of a model, and its caption gives the rule that makes it readable: “Unlisted values are identical to those of the base model.” So the base row is filled in, and almost every row below it is mostly blank — each one shows only the one or two hyperparameters it changed.
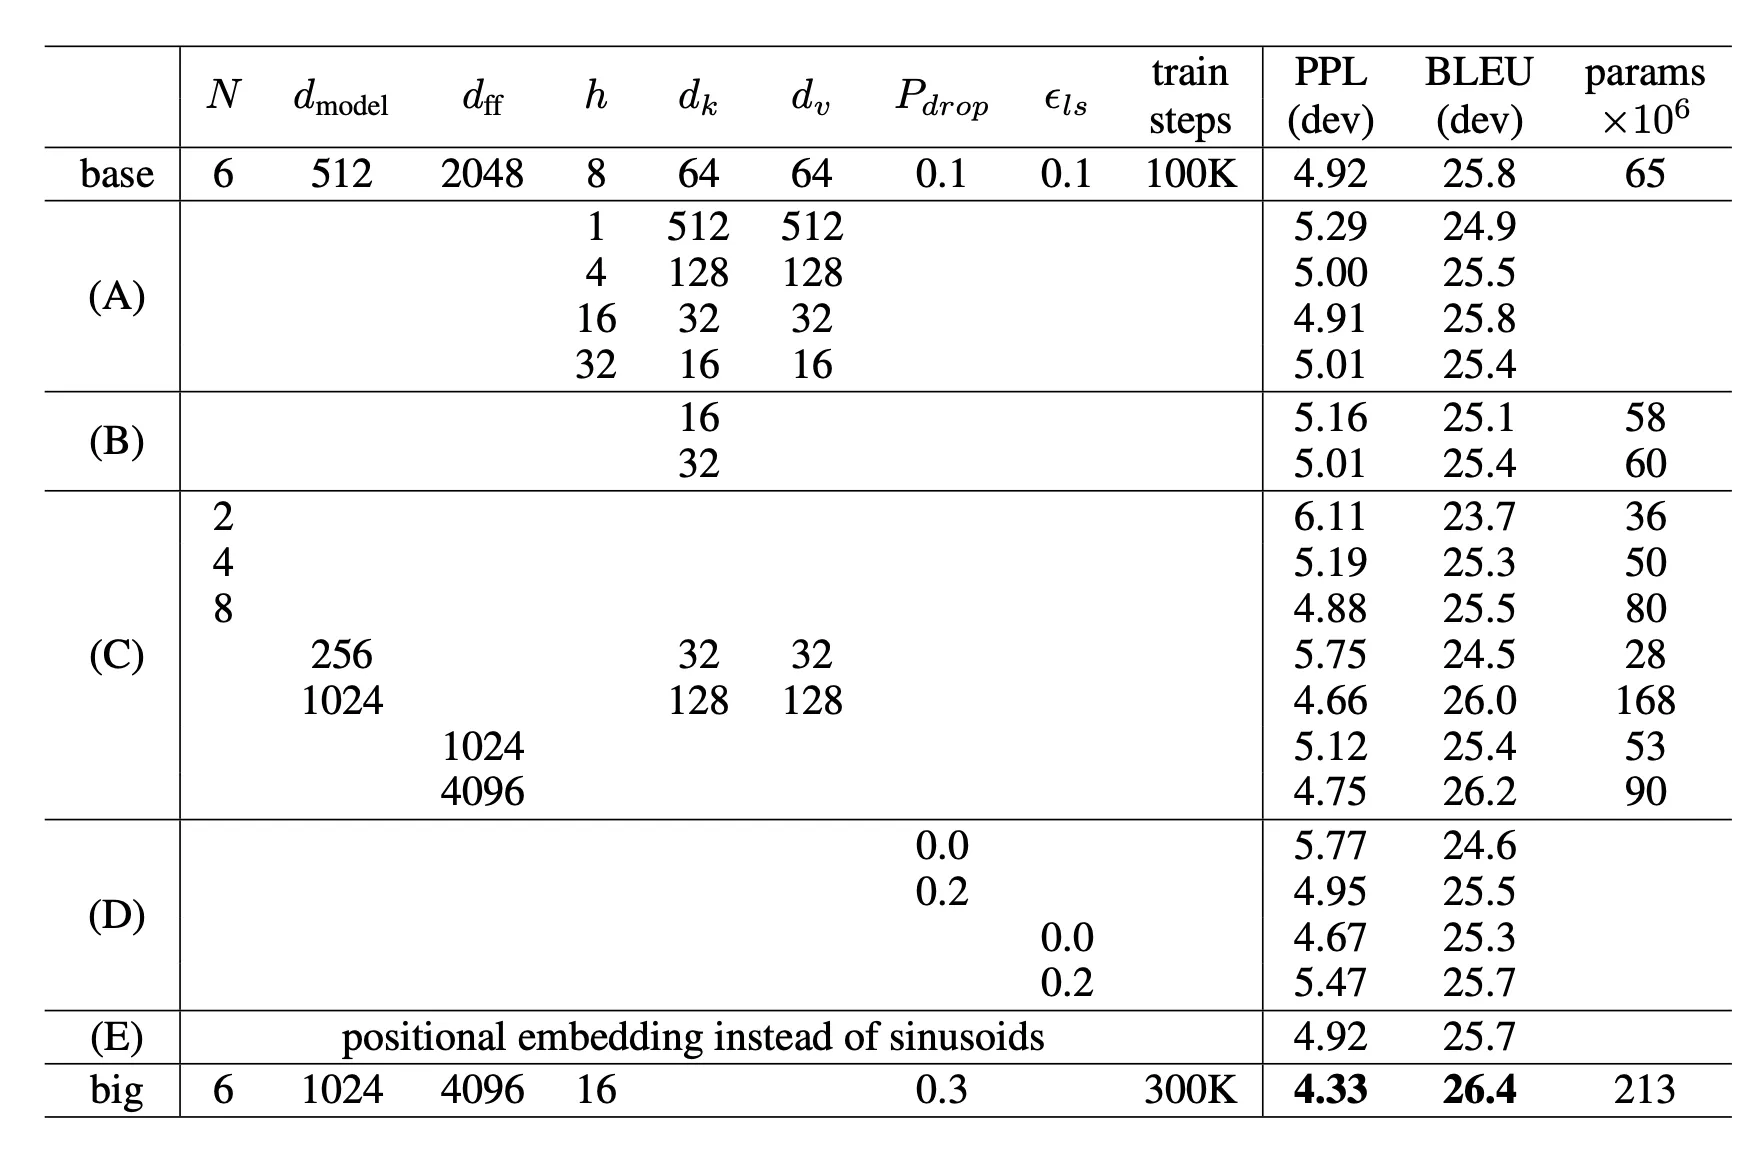
For a human, this is perfect: you see at a glance exactly what each experiment varied. The blanks are the message.
Now ask it something quantitative, say the average model dimension (dmodel) across the (C) group. Suddenly the blanks are the problem. Of the seven rows in that group, five leave dmodel blank; their value is implied, inherited from the base row near the top by a rule stated in prose. So “what is the value in this cell,” the simplest question you can ask a table, has no answer on the page at all. You have to reconstruct it before you can compute anything.
We tried exactly this. We handed the table as printed to three models, Claude Haiku, Sonnet, and Opus, and asked each for that average. The true answer, once the blanks are resolved to the base value of 512, is 548.57. Sonnet got it right. Haiku answered 640: it had averaged only the two dmodel values actually printed in the group and ignored the five blank cells entirely. Opus answered 512, and on a second run visibly thrashed in its reasoning over whether the group had five, six, or seven rows before settling somewhere else. Three models, three different answers, and the disagreement had nothing to do with arithmetic. They split on what a blank cell meant and on which rows even belonged to the group.
Two more details make the point sharper. First, stating the inheritance rule explicitly in the prompt, spelling out that blank means “same as base,” barely changed the results; the hard part was never knowing the convention, it was applying it to a layout that encodes group membership by position. Second, when we asked the same models to average two cells whose values were actually printed on the page, every one of them answered correctly, every time. The failure tracked the blanks, not the calculation. And the deeper point holds regardless of how good any model is at arithmetic: even if the computation were performed flawlessly, by deterministic code that never rounds wrong or drops a digit, it would still be running on the wrong inputs. The form doesn’t just risk a bad calculation. It hides what the calculation is supposed to run on.
This isn’t a limitation specific to machines. The table’s layout is built to show what changed from one period to the next, so a person scanning it reads off those deltas effortlessly, the blanks never trip them up. But ask that same person to average the numbers, and they hit exactly the issue the models did. The form was never meant to answer “what’s the average?”; it answers “what changed?”.
A column with a merged header, a subtotal tucked between detail rows, a blank cell that means “same as above,” a number whose units live three rows up in a section label: none of that is a problem for a person scanning the page, and all of it is a problem for a clean computation. The form was chosen to convey, not to compute.
So to answer questions you have to turn the table into something else — flat, typed, every implicit value made explicit. The blank dmodel cells get filled with 512. The group label that appeared once gets attached to every row it governs. The abbreviations get expanded — 100K becomes 100000, and a params count printed as 65 under a “×10⁶” header becomes 65000000, because to a machine 65 and 65 million are not the same number and nothing on the row says which one is meant. What was a layout becomes a grid where every cell stands on its own and a query can reach any of them without first decoding the arrangement:
| group | N | dmodel | dff | h | dk | dv | Pdrop | epsls | steps | PPL | BLEU | params |
|---|---|---|---|---|---|---|---|---|---|---|---|---|
| C | 2 | 512 | 2048 | 8 | 64 | 64 | 0.1 | 0.1 | 100000 | 6.11 | 23.7 | 36000000 |
| C | 4 | 512 | 2048 | 8 | 64 | 64 | 0.1 | 0.1 | 100000 | 5.19 | 25.3 | 50000000 |
| C | 8 | 512 | 2048 | 8 | 64 | 64 | 0.1 | 0.1 | 100000 | 4.88 | 25.5 | 80000000 |
| C | 6 | 256 | 2048 | 8 | 32 | 32 | 0.1 | 0.1 | 100000 | 5.75 | 24.5 | 28000000 |
| C | 6 | 1024 | 2048 | 8 | 128 | 128 | 0.1 | 0.1 | 100000 | 4.66 | 26.0 | 168000000 |
| C | 6 | 512 | 1024 | 8 | 64 | 64 | 0.1 | 0.1 | 100000 | 5.12 | 25.4 | 53000000 |
| C | 6 | 512 | 4096 | 8 | 64 | 64 | 0.1 | 0.1 | 100000 | 4.75 | 26.2 | 90000000 |
Call it the working form. It’s the thing you actually run a computation against, and it’s almost never shaped like the table in the document. Set it beside the original: where the sparse table showed three changes at a glance, this one is a wall of repeated 512s and 100000s and tells you nothing at a glance. That’s the trade. AVG(dmodel) is now unambiguous, and the cell that had no answer on the page (dmodel where dff=1024) plainly reads 512 — bought with redundancy that makes the form unreadable.
Which is fine, because it was never supposed to read well. You shouldn’t expect any one form to be best at everything. The form that answers “average this column” is not the form that answers “trace this total to its parts,” and neither is the form that reads well on a page. This isn’t special to tables; it’s the ordinary state of things. Optimization theory states a hard version of it as the No Free Lunch theorem: no method beats every other across all possible problems, because an edge on one class of problems is paid for by a deficit on the rest. The consumer packaged goods version is friendlier. When Howard Moskowitz went looking for the perfect spaghetti sauce, he found there wasn’t one, only the best sauce for each kind of eater. A table’s layout is tuned to win at reading. That is exactly why it isn’t tuned to win at computing.
There’s a second thing worth being clear about, and it’s the part that’s easy to skip: the working form cannot be the only thing you keep.
Because the moment you give someone an answer, an average, a flagged row, a computed change, the next question is where did that come from? And the working form can’t answer that. It’s a derivation, a step or two removed from anything the reader recognizes. If you tell an analyst the average dmodel for that group is 548.57 and they ask to see it, pointing at your flattened grid with the blanks filled in shows them your intermediate state, not the paper.
And it asks them to trust two things at once: that your transformation was faithful, with blanks resolved right, rows grouped right, nothing dropped, and that the source underneath says what you claim it does. Bundled together like that, neither is checkable. If the number looks off, they can’t tell whether your pipeline mangled it or the document really says that. Showing the original separates the two: they verify the source against something they recognize, and your transformation becomes a thing they can check against it rather than take on faith. A derivation can be perfectly correct and still not be evidence, because evidence has to be verifiable by the person who doubts it, and they can only verify against the form they already trust.
So the thing they can check is the table as it appeared, the sparse one, with the blanks, in the arrangement they’d find if they opened the document themselves. That original form is useless for the math and essential for the trust. You computed on the version you built; you have to be able to point back at the version they recognize, because it’s the one artifact in the loop you didn’t produce.
Keeping both is the easy part to state. The hard part is everything in the middle: the bridge between the two forms. Going from the document to the working form means recovering structure that was never written down. The base row this table inherits from is named in a caption. In most real documents the rule is in no caption at all, only implied by indentation, a spanning header, a line of whitespace, the fact that one number is bold. You have to infer the convention, apply it, expand the abbreviations and units, and carry an unbroken thread from every resolved cell back to the exact place on the page it came from, so the answer stays traceable. Do that for one clean table from a famous paper and it’s a puzzle. Do it for a document built by someone who was thinking about a printed page and not about you, across thousands of tables that each improvise their own conventions, and the puzzle is most of the problem.
Three modern models couldn’t agree on the average of a column in this table, the tidy one, with the rule spelled out in the caption. That is the measure of how unsolved the general version is. The bridge between the readable form and the computable one, built so the answer comes out both correct and defensible, is the part nobody has finished. It is also the part most worth working on.
The mistake isn’t choosing the wrong form. It’s thinking there’s one form that has to serve both jobs. There isn’t. The table you show and the table you compute on are two different things, and a system that can answer questions from documents and show its work is one that knows to keep them both: the original because that’s where the answer came from, the derived because that’s the only place the answer could be found.
If this is the kind of problem you want to work on, we’re hiring.
Table 3 reproduced from Vaswani et al., “Attention Is All You Need” (2017). https://arxiv.org/abs/1706.03762